
ABLE National Data.
National ABLE Account Data provided by the National Association of State Treasurers (NAST).
Please note quarterly data is released 4-6 weeks upon completion of the quarter.
| Year | Accounts | Assets | Average Balance |
|---|---|---|---|
| 2016 | 4,064 | $13,910,026 | $3,423 |
| 2017 | 17,314 | $71,978,679 | $4,157 |
| 2018 | 34,707 | $171,692,576 | $4,947 |
| 2019 | 57,999 | $354,577,598 | $6,114 |
| 2020 | 81,869 | $638,630,483 | $7,801 |
| 2021 | 112,021 | $1,044,096,837 | $9,321 |
| 2022 | 137,192 | $1,252,898,971 | $9,132 |
| 2023 | 162,969 | $1,740,821,191 | $10,682 |
| 2024 | 195,407 | $2,303,109,777 | $11,786 |
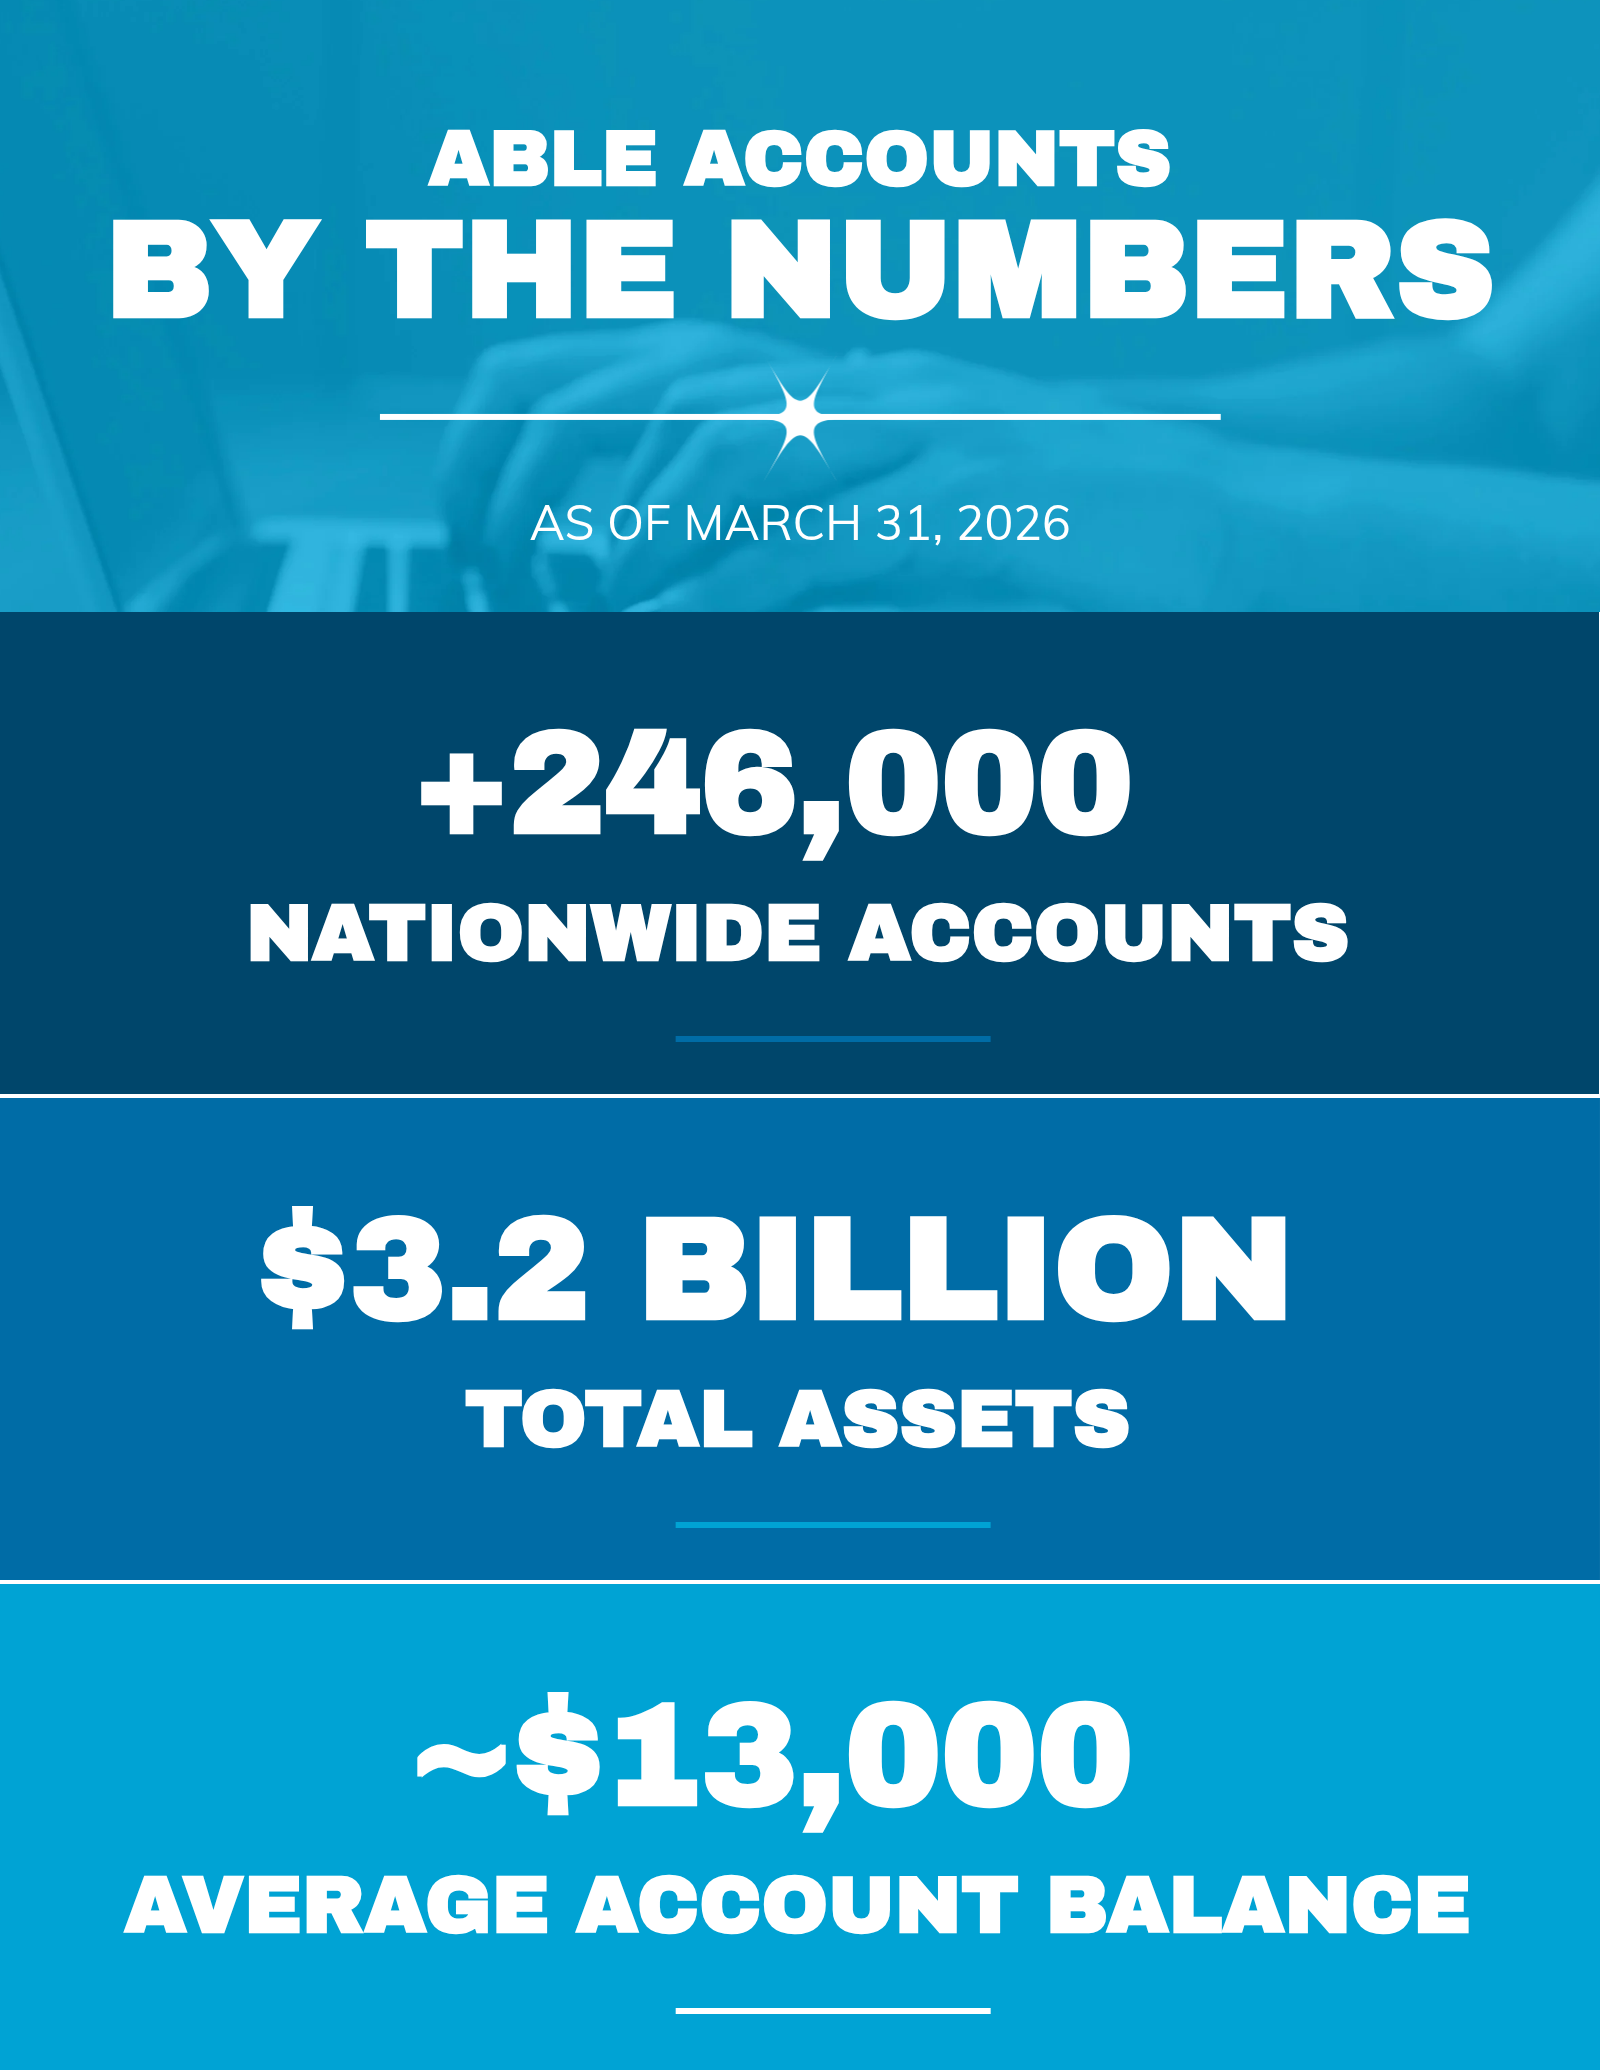
| 2025 | 235,731 | $3,063,878,534 | $12,997 |